Legal cannabis stores in Canada, by the numbers
Counts of licensed and government-run cannabis stores in each province and territory, from the official registries we list. Updated October 30, 2026.
Stores per 100,000 people
Highest to lowest, with Canada overall in orange. Free to share with credit (CC BY 4.0).
Share or embed this chart
- Download PNG (social posts, print)
- Open SVG (sharp at any size)
- Data as CSV
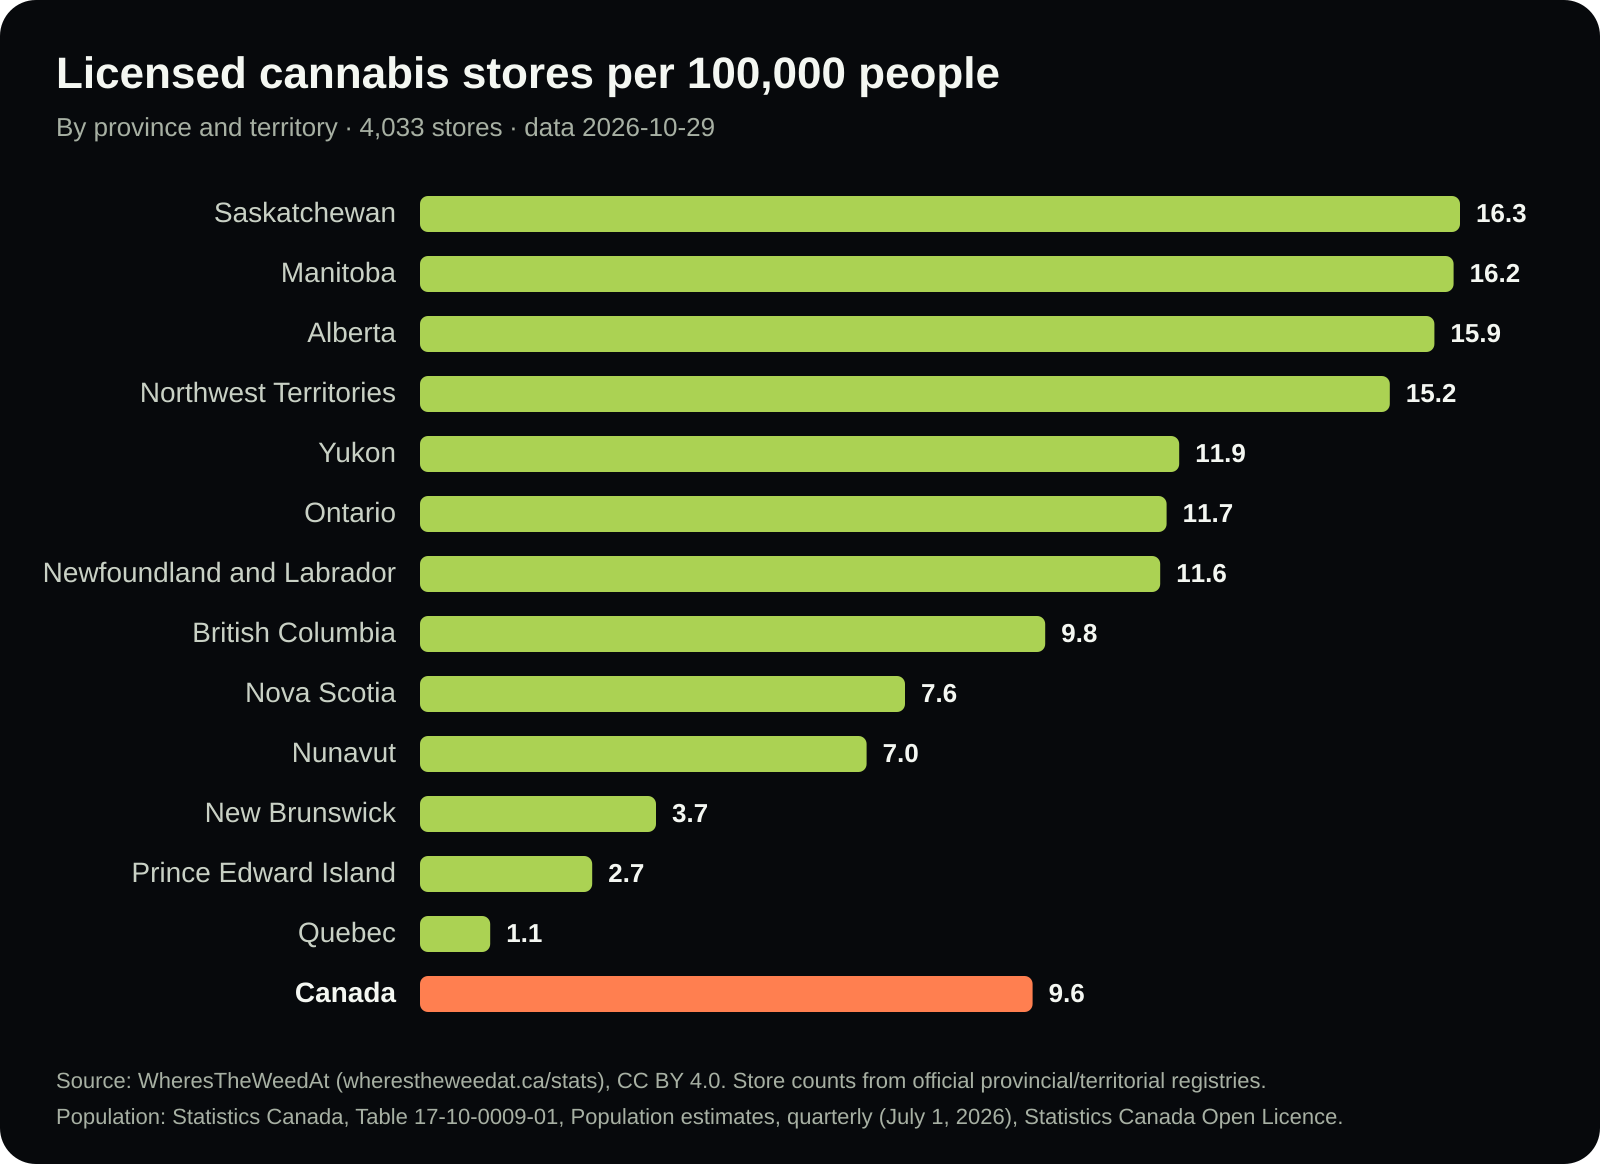
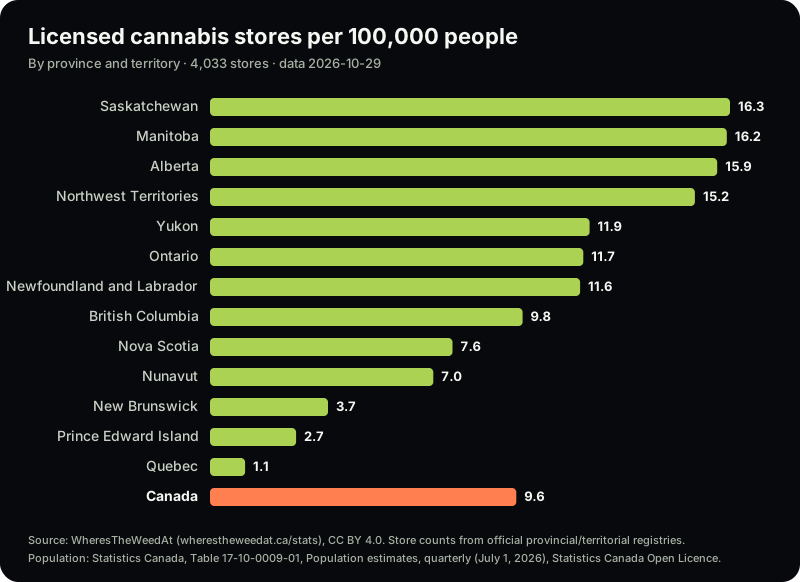
For journalists: credit “WheresTheWeedAt, CC BY 4.0” and Statistics Canada for population. The embedded chart updates when registries change.
By province and territory
| Region | Stores | Per 100k | Communities | Gov’t-run | Website listed | Hours listed | Registry checked |
|---|---|---|---|---|---|---|---|
| Ontario | 1,903 | 11.7 | 325 | 0 | 74.7% | 0% | October 23, 2026 |
| Alberta | 809 | 15.9 | 151 | 0 | 19% | 0% | October 23, 2026 |
| British Columbia | 562 | 9.8 | 160 | 39 | 3.4% | 6.9% | October 23, 2026 |
| Manitoba | 246 | 16.2 | 72 | 0 | 11.8% | 0% | October 23, 2026 |
| Saskatchewan | 208 | 16.3 | 92 | 0 | 83.2% | 0% | October 23, 2026 |
| Quebec | 103 | 1.1 | 73 | 103 | 100% | 98.1% | October 23, 2026 |
| Nova Scotia | 84 | 7.6 | 62 | 84 | 100% | 100% | October 23, 2026 |
| Newfoundland and Labrador | 64 | 11.6 | 43 | 0 | 6.3% | 0% | October 23, 2026 |
| New Brunswick | 33 | 3.7 | 21 | 33 | 100% | 100% | October 23, 2026 |
| Northwest Territories | 7 | 15.2 | 6 | 0 | 14.3% | 0% | October 23, 2026 |
| Yukon | 6 | 11.9 | 3 | 0 | 16.7% | 0% | October 23, 2026 |
| Prince Edward Island | 5 | 2.7 | 5 | 5 | 100% | 100% | October 23, 2026 |
| Nunavut | 3 | 7.0 | 2 | 0 | 100% | 0% | October 23, 2026 |
| Canada | 4,033 | 9.6 | 1,015 | 264 | 50.3% | 6.5% |
Communities with the most stores
- 1.Toronto, ON371
- 2.Calgary, AB201
- 3.Edmonton, AB189
- 4.Winnipeg, MB141
- 5.Ottawa, ON116
- 6.Vancouver, BC87
- 7.Mississauga, ON67
- 8.Hamilton, ON64
- 9.London, ON64
- 10.Windsor, ON49
- 11.Brampton, ON44
- 12.Saskatoon, SK38
- 13.Regina, SK37
- 14.Kitchener, ON33
- 15.Victoria, BC32
- 16.Oshawa, ON31
- 17.St Catharines, ON31
- 18.Burlington, ON27
- 19.Barrie, ON25
- 20.Guelph, ON23
Month over month
We record a snapshot each month. Changes will appear here once there are two months to compare.
| Month | Stores |
|---|---|
| 2026-10 | 4,034 |
Download the data
The province table as CSV or JSON. Free to reuse with attribution under CC BY 4.0. The files contain counts only, no store-level records. Per-community counts and press notes are on the open dataset page.
How to cite
Where’s The Weed At. “Legal cannabis stores in Canada: statistics by province.” https://wherestheweedat.ca/stats (accessed 2026-10-30).
Source: WheresTheWeedAt (wherestheweedat.ca/stats), 2026-10-30. Licence: CC BY 4.0. Population: Statistics Canada, Table 17-10-0009-01, Population estimates, quarterly (July 1, 2026), released 2026-09-23, https://www150.statcan.gc.ca/t1/tbl1/en/tv.action?pid=1710000901, Statistics Canada Open Licence.
Methodology
Stores. Every store listed on Where’s The Weed At, which means every store on the official provincial or territorial list of legal retailers we use (see how we verify). Stores marked closed, or removed by their owner, aren’t counted. Ontario counts only stores the AGCO has authorized to open.
Per 100,000 people. Stores divided by the Statistics Canada, Table 17-10-0009-01, Population estimates, quarterly (July 1, 2026) figure, times 100,000. Source: Statistics Canada, used under the Statistics Canada Open Licence. Population estimates are for July 1, 2026 (Q3 2026), released September 23, 2026. This does not constitute an endorsement by Statistics Canada of this product.
Communities. Distinct city, town or municipality names on the registries. Registries name places differently, so treat this as approximate.
Website and hours listed. Share of stores with a website or opening hours on their listing, from the registry or the store owner. A missing value means we don’t have it, not that the store has none.
Monthly snapshots. We save the same counts once a month so changes can be compared. Earlier months can’t be rebuilt, so the history starts with our first snapshot.
Limitations
- Registries update on their own schedules; each province shows the date we last checked its list.
- Some lists include stores licensed but not yet open; those are counted where the registry lists them as licensed.
- These are counts of stores, not sales, use, or demand.